Rain amounts represent the vertical depth of water that reaches the ground surface over a specific duration, typically measured in millimeters or inches. As of 2026, these measurements are vital for monitoring climate patterns, managing municipal drainage systems, and optimizing agricultural yields by quantifying exactly how much liquid precipitation has fallen within a defined geographic area.
The Significance of Precise Rain Measurement
Accurate tracking of rain amounts serves as the backbone for hydrological modeling and disaster preparedness. In 2026, the convergence of high-resolution satellite imagery and localized ground sensors has made it possible to track precipitation with unprecedented granularity. However, the core purpose remains the same: understanding the volume of water entering an ecosystem.
For a homeowner, 1 inch of rain may seem like a minor occurrence, but when translated into volume across a standard roof, it results in hundreds of gallons of water that must be diverted by gutters and downspouts. For a farmer, the difference between 0.5 inches and 1.5 inches of rain during a critical growth phase can determine the success or failure of a season's crop. On a municipal level, civil engineers rely on historical rain amount data to design culverts and sewer systems capable of handling "100-year storm" events, which are increasingly being redefined by shifting atmospheric patterns.
Understanding rain amounts also requires a distinction between "rainfall" and "precipitation." While all rain is precipitation, not all precipitation is rain. Rain amounts specifically track liquid water, whereas snow and hail are often converted to "liquid equivalent" to maintain a standardized data set for climatologists.
Modern Techniques for Measuring Rain Amounts
The technology used to capture rain data has evolved from simple collection vessels to sophisticated electronic sensors. Each method offers a different balance of accuracy, maintenance requirements, and data frequency.
Manual Rain Gauges
The standard manual rain gauge remains the most accurate tool for point-source measurement. These devices typically consist of a wide-mouthed funnel that leads into a narrower graduated cylinder. This design "magnifies" the rainfall, allowing observers to measure small amounts, such as 0.01 inches, with high precision. While these require physical inspection and emptying, they are the gold standard for networks like the Community Collaborative Rain, Hail, and Snow Network (CoCoRaHS).
Tipping Bucket Gauges
Common in automated weather stations (AWS), the tipping bucket gauge uses a small seesaw mechanism. Once a specific amount of water (usually 0.01 inch or 0.1 mm) fills one side of the bucket, it tips, sending an electrical pulse to a data logger. While excellent for tracking rainfall intensity and timing, tipping buckets can under-report during extreme downpours because water is lost during the "tip" motion.
Ultrasonic and Radar Sensors
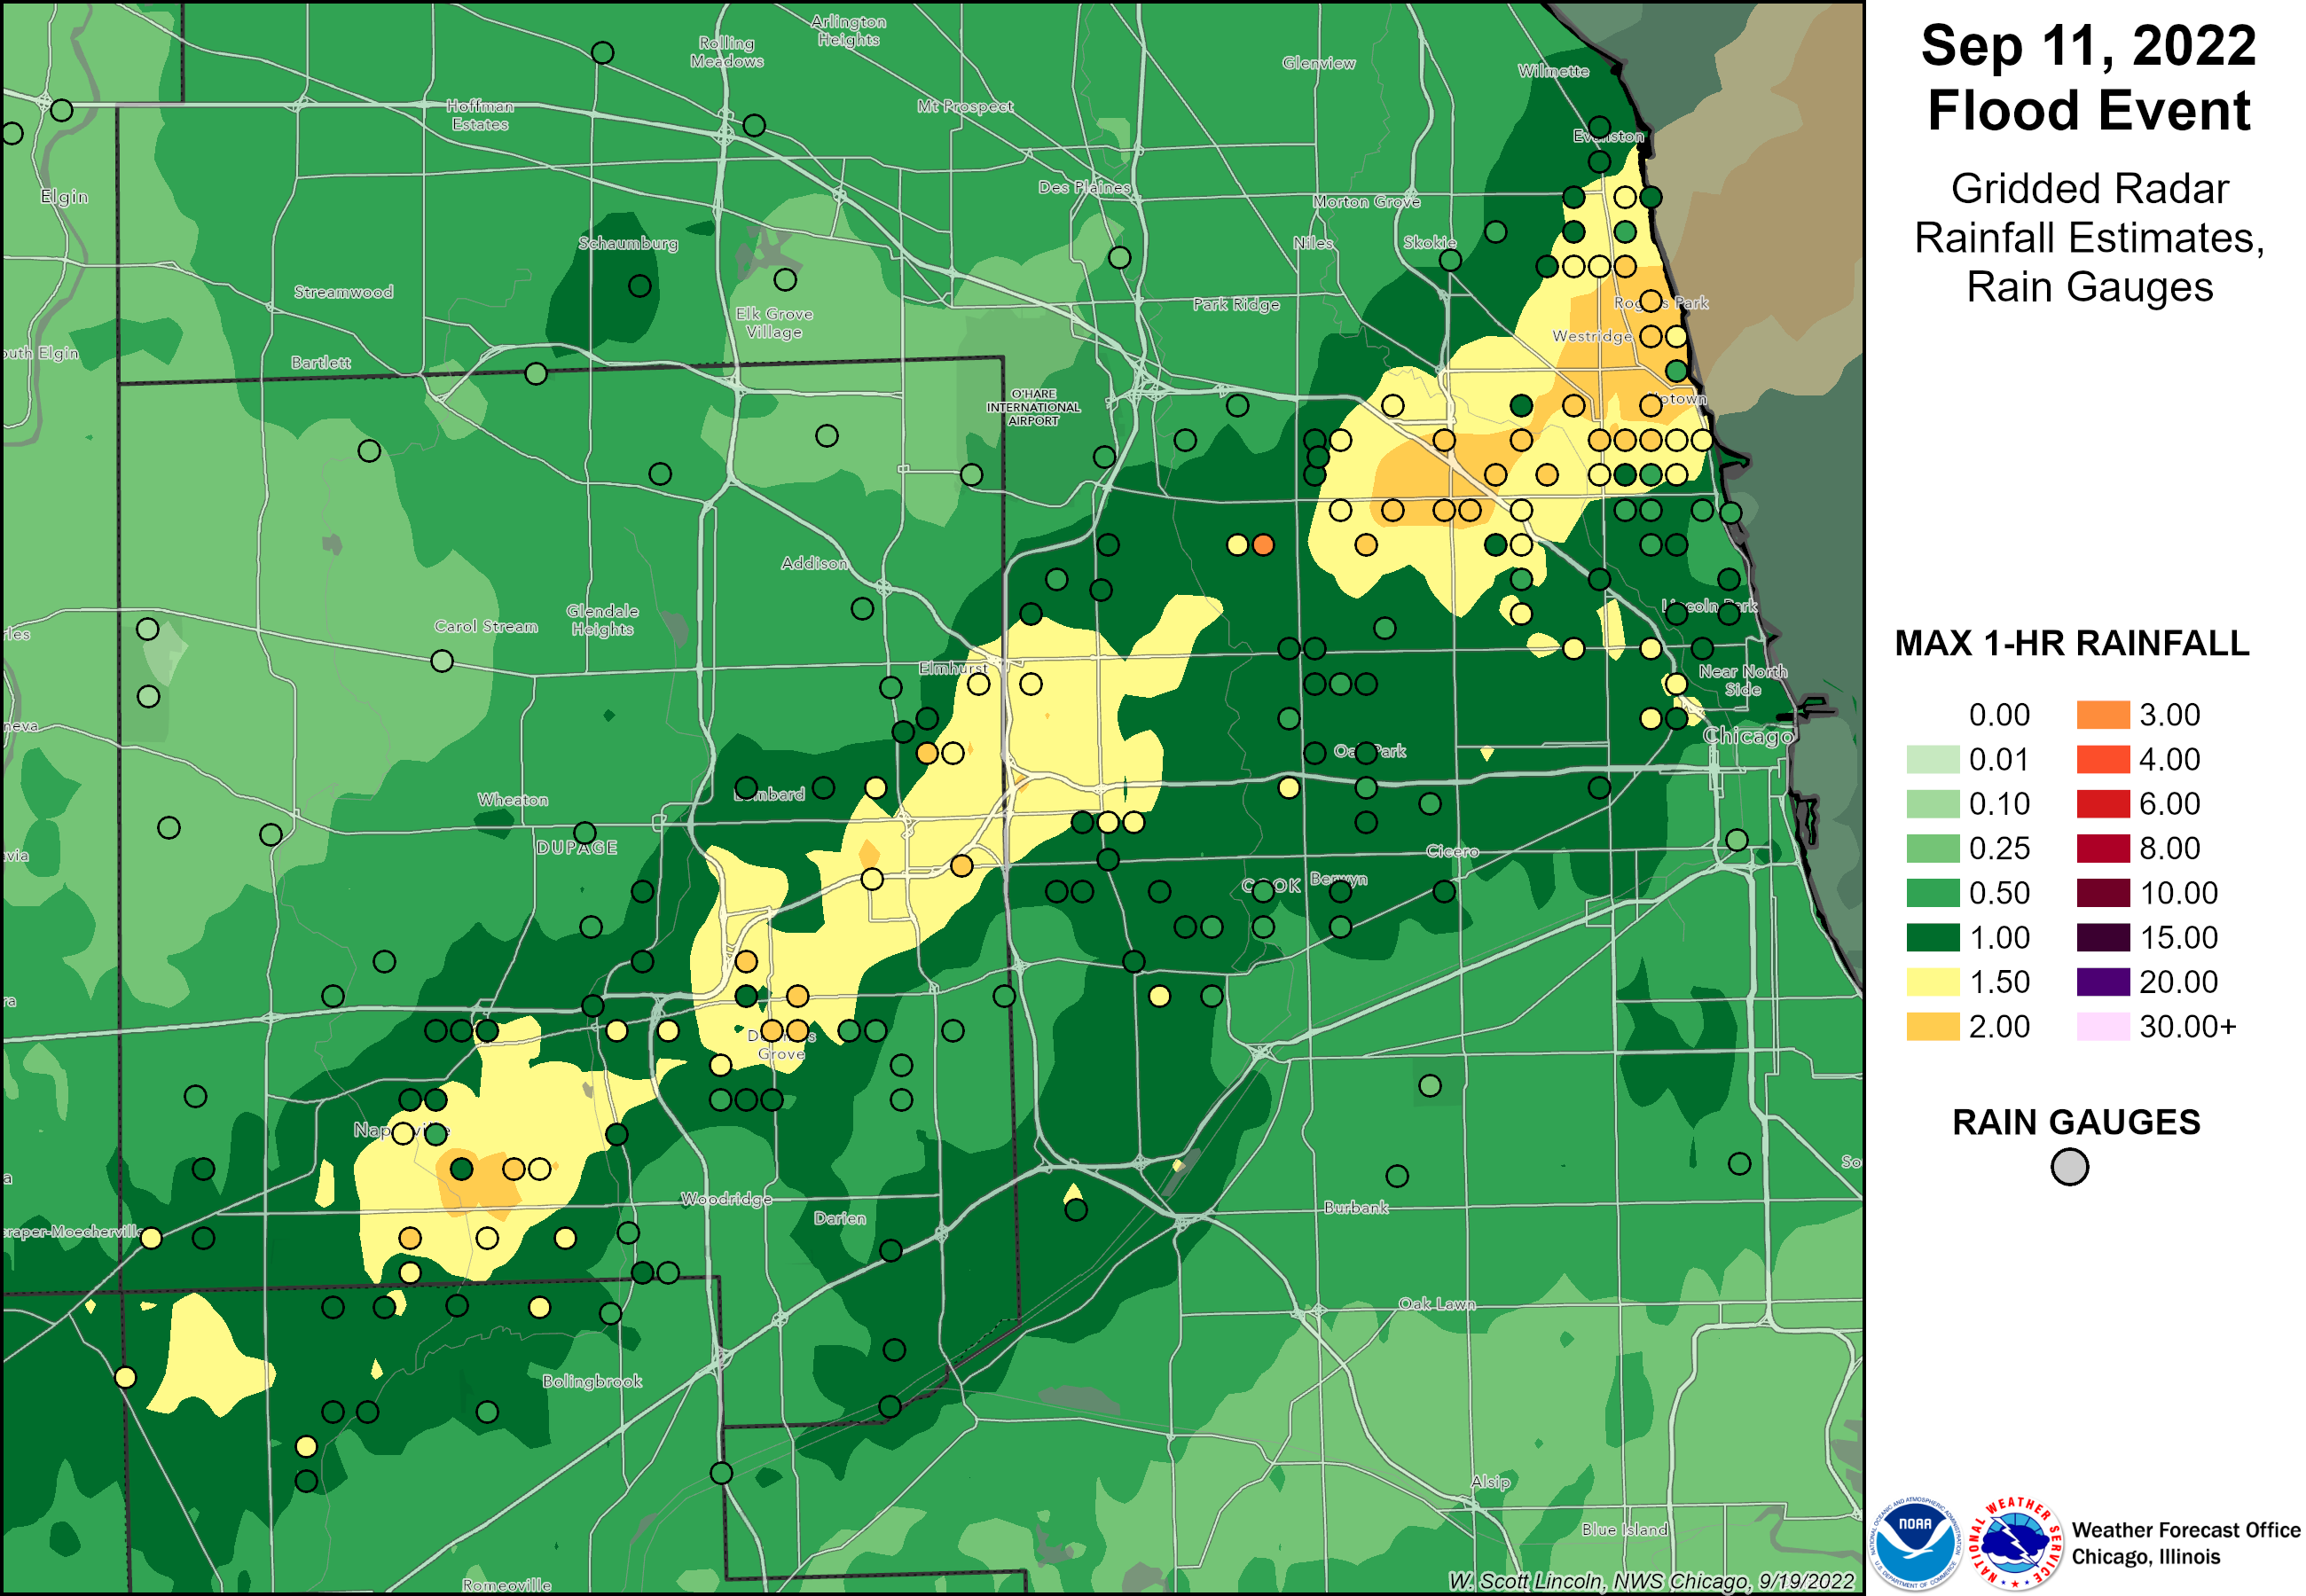
By 2026, many professional meteorological sites have transitioned to non-mechanical sensors. Ultrasonic sensors measure the impact and size of individual raindrops to calculate total volume. Similarly, Dual-Polarization (Dual-Pol) Radar allows National Weather Service offices to estimate rain amounts over vast areas by analyzing the shape and density of falling drops. This fills the gaps between physical gauges, providing a comprehensive "map" of a storm’s path.
Understanding Rain Intensity Classifications
Rain amounts are often categorized by their intensity, which is the rate at which the rain falls. This classification is essential for issuing flood warnings and managing transportation safety. The World Meteorological Organization (WMO) and various national agencies use standardized thresholds to define these categories.
| Classification | Rainfall Rate (Metric) | Rainfall Rate (Imperial) | Common Impact |
|---|---|---|---|
| Light Rain | < 2.5 mm per hour | < 0.10 in per hour | Minimal runoff; visibility remains mostly clear. |
| Moderate Rain | 2.5 to 7.6 mm per hour | 0.10 to 0.30 in per hour | Puddles begin to form; continuous sound on roofs. |
| Heavy Rain | > 7.6 mm per hour | > 0.30 in per hour | Significant runoff; potential for localized flooding. |
| Violent Rain | > 50 mm per hour | > 2.0 in per hour | Dangerous flash flooding; extreme visibility reduction. |
It is important to note that a "heavy rain" event lasting only ten minutes will result in a much lower total rain amount than a "light rain" event that persists for 24 hours. Therefore, both the rate (intensity) and the duration are required to calculate the total accumulation.
The Mathematics of Precipitation: Volume and Weight
To truly grasp the impact of rain amounts, one must convert depth into volume and weight. This is particularly useful for civil engineering and agricultural planning.
The One-Inch Rule
A standard measurement used by hydrologists is the "acre-inch." This represents the volume of water produced by 1 inch of rain falling over 1 acre of land.
- Area: 1 acre (43,560 square feet).
- Volume: 1 inch of rain equals 3,630 cubic feet of water.
- Gallons: This translates to approximately 27,154 gallons of water per acre.
- Weight: Since a gallon of water weighs about 8.34 pounds, 1 inch of rain on an acre weighs over 226,000 pounds (roughly 113 tons).
Residential Impact
On a smaller scale, a 1,500-square-foot roof will collect approximately 935 gallons of water during a 1-inch rain event. If a property’s drainage system is not designed to move nearly 1,000 gallons of water away from the foundation quickly, hydrostatic pressure can lead to basement leaks or structural damage. This calculation highlights why even seemingly small rain amounts require serious infrastructure management.
Accessing Rain Amount Data in 2026
In 2026, stakeholders have several reliable ways to access real-time and historical rainfall data. Whether for insurance claims, gardening, or scientific research, the following resources provide verified information.
- National Centers for Environmental Information (NCEI): Managed by NOAA, this is the primary archive for climate data in the United States. Users can access the Global Historical Climatology Network to find daily rain totals for thousands of stations.
- CoCoRaHS: This volunteer-driven network provides high-density precipitation maps. Because it relies on human-verified manual gauges, it is often more accurate for specific neighborhoods than interpolated radar data.
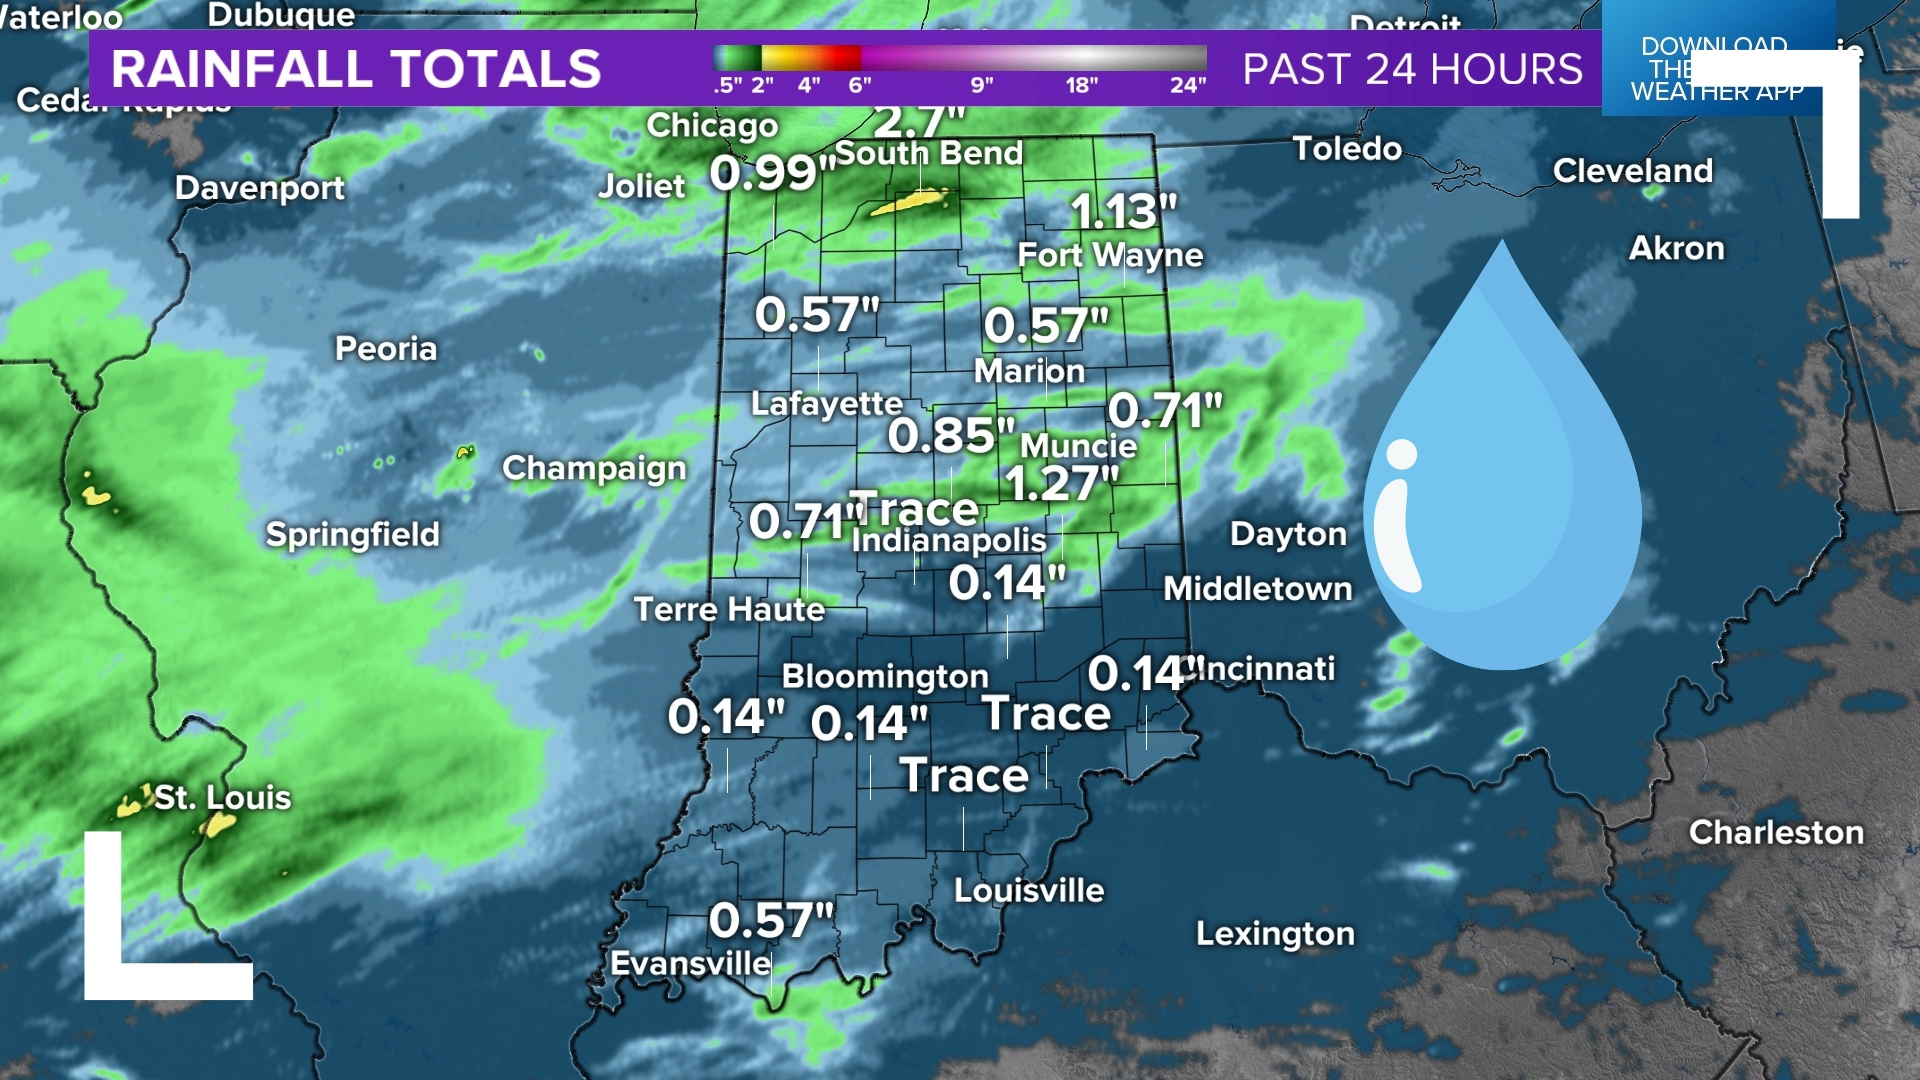
- National Weather Service (NWS) Precipitation Analysis: The NWS provides interactive maps that allow users to view rain amounts over the last 24 hours to 30 days, using a blend of gauge and radar data.
- Local Mesonets: Many states and universities operate "mesonets," which are networks of automated weather stations that provide hyper-local rain data updated every few minutes.
Factors That Affect Measurement Accuracy
Obtaining an accurate rain amount is more difficult than simply placing a bucket outside. Several environmental factors can "bias" the reading, leading to under- or over-reporting.
Wind Under-catch
Wind is the greatest enemy of rain gauge accuracy. As wind moves across the mouth of a gauge, it creates turbulence that can deflect smaller raindrops away from the opening. This usually results in "under-catch," where the gauge records less rain than actually fell on the surrounding ground. Professional stations often use "wind shields"—a ring of metal slats around the gauge—to slow the air and ensure drops fall vertically into the collector.
Siting and Obstructions
The placement of a rain gauge is critical. To avoid interference, a gauge should be placed at a distance from any obstacle (like a tree or building) that is at least twice the height of that obstacle. If a gauge is too close to a house, the building can block rain coming from a certain direction (rain shadow) or, conversely, cause extra water to splash into the gauge from the roof or eaves.
Evaporation and Out-splashing
In hot, arid climates, small amounts of rain can evaporate from the gauge before they are recorded, especially in manual gauges that are not checked immediately. Conversely, during "violent" rain events, heavy drops can hit the funnel and splash back out before they enter the collection tube, a phenomenon known as out-splashing.
Practical Applications for Various Sectors
Agriculture and Irrigation
Farmers use rain amounts to calculate the "moisture deficit" in their soil. By knowing exactly how much free water was provided by nature, they can adjust their irrigation schedules to save water and prevent nutrient leaching caused by over-watering.
Construction and Engineering
For construction sites, rain amounts dictate "workable days." Excessive rain can saturate soil to the point where heavy machinery cannot operate safely or where concrete cannot be poured. Furthermore, post-construction sites must prove that their "Stormwater Pollution Prevention Plan" (SWPPP) was effective during specific rain events to remain compliant with environmental regulations.
Insurance and Legal Verification
Insurance adjusters frequently use certified rain amount reports to verify claims related to storm damage. If a homeowner claims a basement flooded due to a sudden downpour, the adjuster will check official records to see if the rain amounts in that ZIP code reached a threshold that would justify such a claim.
Common Mistakes in Tracking Rainfall
One of the most frequent errors is relying on "smart" irrigation sensors or consumer-grade weather stations without proper calibration. Many home weather stations use small tipping buckets that can easily become clogged with debris, bird droppings, or spider webs. Without regular maintenance, these devices may report zero rainfall even during a storm.
Another mistake is confusing "probability of precipitation" (PoP) with "rain amounts." A 50% chance of rain does not mean it will rain half an inch; it means there is a 50% chance that at least 0.01 inch of rain will fall somewhere in the forecast area. To plan effectively, one must look at the "Quantitative Precipitation Forecast" (QPF), which provides the actual expected rain amount in inches or millimeters.
FAQs About Rain Amounts
How much rain is considered a "heavy" downpour?
In meteorological terms, heavy rain is generally defined as a rainfall rate of more than 0.30 inches (7.6 mm) per hour. However, the perception of "heavy" can vary by region. In an arid climate, 0.5 inches in an hour could cause flash flooding, whereas, in a tropical rainforest, that might be considered a standard afternoon shower.
Why does my neighbor’s rain gauge show a different amount than mine?
Rainfall, especially during summer thunderstorms, is highly localized. A single convective cell may be only a few miles wide, dumping two inches of rain in one spot while leaving a location just a mile away completely dry. This variability is why high-density networks like CoCoRaHS are so valuable.
How is snow converted into rain amounts?
To include snow in total precipitation records, meteorologists melt the captured snow to find its "liquid equivalent." While the standard ratio is often cited as 10 inches of snow to 1 inch of rain, this varies wildly. Heavy, wet snow might have a 5:1 ratio, while light, "powder" snow can be as high as 30:1.
Can radar alone accurately measure rain amounts?
No, radar provides an estimate based on reflectivity. While it is excellent for seeing where rain is falling, it can be fooled by hail (which reflects more energy) or "virga" (rain that evaporates before hitting the ground). For the highest accuracy, radar data must be "ground-truthed" using physical rain gauges.
What is a "trace" amount of rain?
A "trace" (recorded as 'T') is defined as an amount of precipitation that is visible but less than the minimum measurable amount on a standard gauge (usually less than 0.01 inches or 0.1 mm). It indicates that the ground was dampened, but no significant volume was collected.
Recommendations for Monitoring Rain
For those requiring precise rain amount data, the following steps are recommended:
- Install a high-quality manual gauge: A 4-inch diameter clear plastic gauge (standard for CoCoRaHS) is the most reliable and affordable way to start.
- Ensure proper siting: Place the gauge in an open area, away from trees, fences, and overhangs to minimize wind turbulence and obstructions.
- Cross-reference with official sources: Always compare your local readings with the nearest National Weather Service or airport station to identify potential equipment malfunctions or localized anomalies.
- Maintain your equipment: If using an automated station, clean the debris screens and leveling of the tipping bucket at least once every three months to ensure continued accuracy.